


Imagine combining the simplicity of Excel with the power of Python. Exciting, right? This dream is becoming a reality as the Python Editor in Excel is being rolled out to more users. Whether you’re a data enthusiast, a financial analyst, or a student, this integration promises to make your life a whole lot easier.
What is the Python Editor in Excel?
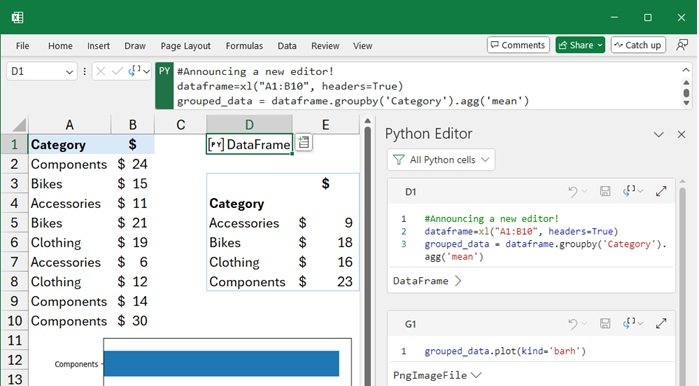
The Python Editor in Excel is a tool that allows users to write and execute Python scripts directly within Excel. This integration means you can leverage Python’s robust libraries for data analysis, visualization, and automation without ever leaving your spreadsheet.
Why is This Important?
Excel has been a staple for data manipulation and analysis for decades. It’s user-friendly, widely adopted, and incredibly versatile. However, it does have limitations, especially when dealing with complex data analysis or automation tasks. Python, on the other hand, is a powerhouse for data science and automation but lacks the intuitive, grid-based interface that Excel users love. Combining the two allows users to enjoy the best of both worlds.
Real-Life Applications
Let’s dive into some real-life examples to illustrate how this integration can be a game-changer.
1. Financial Modeling Imagine you’re a financial analyst working on a complex financial model. Traditionally, you would rely on Excel functions and possibly VBA for automation. With the Python Editor, you can now use Python libraries like Pandas for data manipulation and Matplotlib for visualization. This means you can create more sophisticated models, automate repetitive tasks, and generate insightful visualizations all within Excel.
2. Data Analysis for Research If you’re a researcher handling large datasets, the Python Editor in Excel can be a lifesaver. Instead of exporting data to an external Python environment, you can perform your entire analysis within Excel. Libraries like NumPy and SciPy can help you conduct statistical analyses, while Seaborn can be used for advanced visualizations. This seamless workflow can save you a lot of time and effort.
3. Automating Reports For professionals who regularly generate reports, automation is key. With Python in Excel, you can write scripts to pull data from various sources, clean and process the data, and generate comprehensive reports automatically. For example, you could write a script that fetches sales data from a database, processes it to calculate key metrics, and then creates a summary report with charts and tables, all within Excel.
Getting Started
If you’re eager to start using Python in Excel, here are some steps to get you going:
- Check Availability: Ensure that the Python Editor feature is available in your version of Excel. Microsoft is gradually rolling it out to more users, so keep an eye out for updates.
- Install Necessary Libraries: While some libraries may come pre-installed, you might need to install others based on your requirements. Libraries like Pandas, NumPy, Matplotlib, and Seaborn are commonly used.
- Learn Basic Python: If you’re new to Python, there are plenty of resources available online to help you get started. Focus on the basics and gradually move on to more advanced topics as you become comfortable.
- Explore Examples: Look for tutorials and examples online to see how other users are leveraging this integration. This can give you ideas and help you understand best practices.
Conclusion
The integration of the Python Editor in Excel is a significant step forward for both Excel and Python users. It opens up a world of possibilities for more advanced data analysis, automation, and visualization, all within the familiar Excel environment. Whether you’re a seasoned programmer or an Excel enthusiast, this tool can enhance your productivity and streamline your workflow. So, start exploring, experimenting, and see how this powerful combination can transform the way you work with data.
1 Pingback